Table of contents
When a Minecraft server lags, you usually want to know whether there are too many mobs, too many hoppers, or whether a plugin slows the server down. CPU usage cannot answer that. spark is a profiler for Minecraft servers, and it records where the server spends its time. If you record a report during the lag, the item with the largest share shows where the delay comes from.
I tested on Windows 11, an i7-12700, Java 25, and Paper 26.3 build 240. Paper has bundled spark since 1.21, so you do not need to install it separately. If your server still runs Spigot, you can migrate it to Paper first. I created all the loads in this article for testing, and the notes on how are in the test notes.
Confirm the lag comes from the server
When the server feels slow, first type spark tps in the server window. The server updates the world 20 times per second. Each update is a tick, so each tick has to finish within 50 ms. TPS is the number of ticks actually completed per second, and the maximum is 20. The screenshot below is from a server with too many cows. TPS was about 16.3, and the median tick time was above 50 ms:
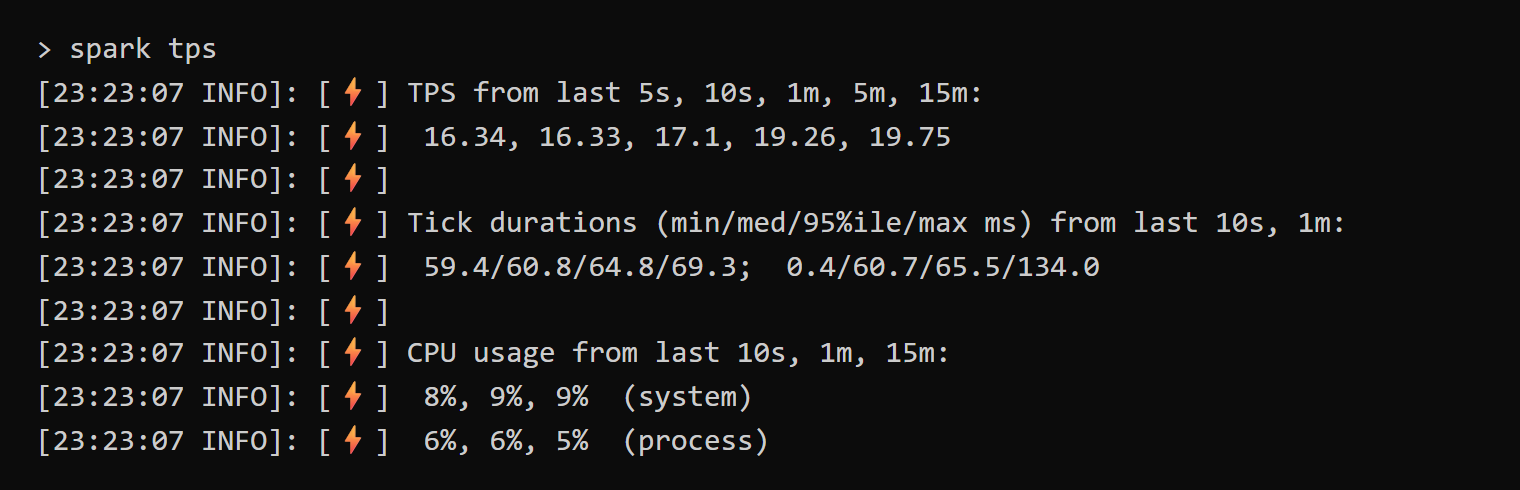
* in front of it, the real value is slightly above 20, and spark only displays up to 20, so you do not need to do anything.
The Tick durations line shows the time per tick. The four numbers are the minimum, median, 95th percentile, and maximum. The numbers before the semicolon are for the last 10 seconds, and the numbers after it are for the last minute. In the first minute after the server starts, there are ticks that last several seconds, so look at the numbers before the semicolon.
This table shows what the numbers on these two lines mean and what to do:
Result of spark tps |
Situation | What to do |
|---|---|---|
| TPS close to 20, and the maximum is below 50 ms | Server ticks are normal | The lag is not caused by ticks, so you do not need a report |
| TPS below 20, median above 50 ms | Every tick is too slow | Record a normal report |
| TPS below 20, median normal, maximum far above 50 ms | Normal most of the time, stalls occasionally | Record a report that only keeps slow ticks |
CPU usage does not show this kind of lag. The world is mostly updated by one thread, Server thread. My test computer has 20 threads, so one fully loaded thread is only about 5%. When TPS dropped to around 16, spark reported only about 6% CPU usage for the server process. The Can't keep up warning in the console is the same. In my test, even when TPS dropped to 12.5, this warning did not appear.
Record a spark report
After you confirm the server ticks are slow, record the report while the lag is still happening, because once the problem is over, the cause cannot be recorded. The server keeps running during recording, and you do not need to shut it down:
- Type
spark profiler start --timeout 60in the server window to record for 60 seconds. - When recording ends, the server window prints a link that starts with
https://spark.lucko.me/. - Open the link in a browser to see the report.
When the server starts on Windows, it prints The async-profiler engine is not supported. You can ignore it, and spark switches to its built-in Java engine.
If the server is normally fine and only stalls now and then, use this command instead. It only records ticks longer than 150 ms:
1spark profiler start --timeout 60 --only-ticks-over 150
The threshold has to be higher than a normal tick and lower than the time of a stall. You can use the maximum shown by spark tps to adjust it.
When the server prints the link, the report has already been uploaded to the spark website. The privacy policy says reports are kept for 90 days, and anyone with the link can view them. A report contains the operating system, the CPU, the JVM startup arguments, the plugin list, some server settings, and the name of the person who ran the command. When you paste the link somewhere public, this information becomes public too.
If you do not want to upload the report, type spark profiler start without --timeout to start recording. After about 60 seconds, type spark profiler stop --save-to-file, and the report is saved in the server’s plugins/spark folder. Then drag this .sparkprofile file into the box on the spark website home page, and you can read the report in the same view. In my test, the browser sent no upload request.
Read the report
At the top of the report, MSPT is the time per tick in milliseconds, and med is the median. The max may include long ticks from server startup, such as 5860 in the screenshot below, so only look at med:

The percentages in the report are the share of the whole report that this piece of code takes. After you check med, scroll down to the “Profiler” section and find the item with the largest share in this order:
- Click
Server threadto expand it. - Open the items with a percentage close to 100% level by level until you reach
MinecraftServer.tickChildren(). There are about nine levels in between. - Open
tickChildren()and look at the item with the largest share under it. If it isServerLevel.tick(), expand one more level.
After you find the item with the largest share, use this table to match it with the source of the delay:
| Item with the largest share | Source | What to do |
|---|---|---|
EntityTickList.forEach() |
Entities, such as animals and mobs | Use a command to find the entity type with the highest count and reduce it |
Level.tickBlockEntities() |
Block entities, such as hoppers | Reduce the number of block entities |
CraftScheduler.mainThreadHeartbeat() |
Scheduled tasks of a plugin | Update or remove the plugin |
Report for too many entities
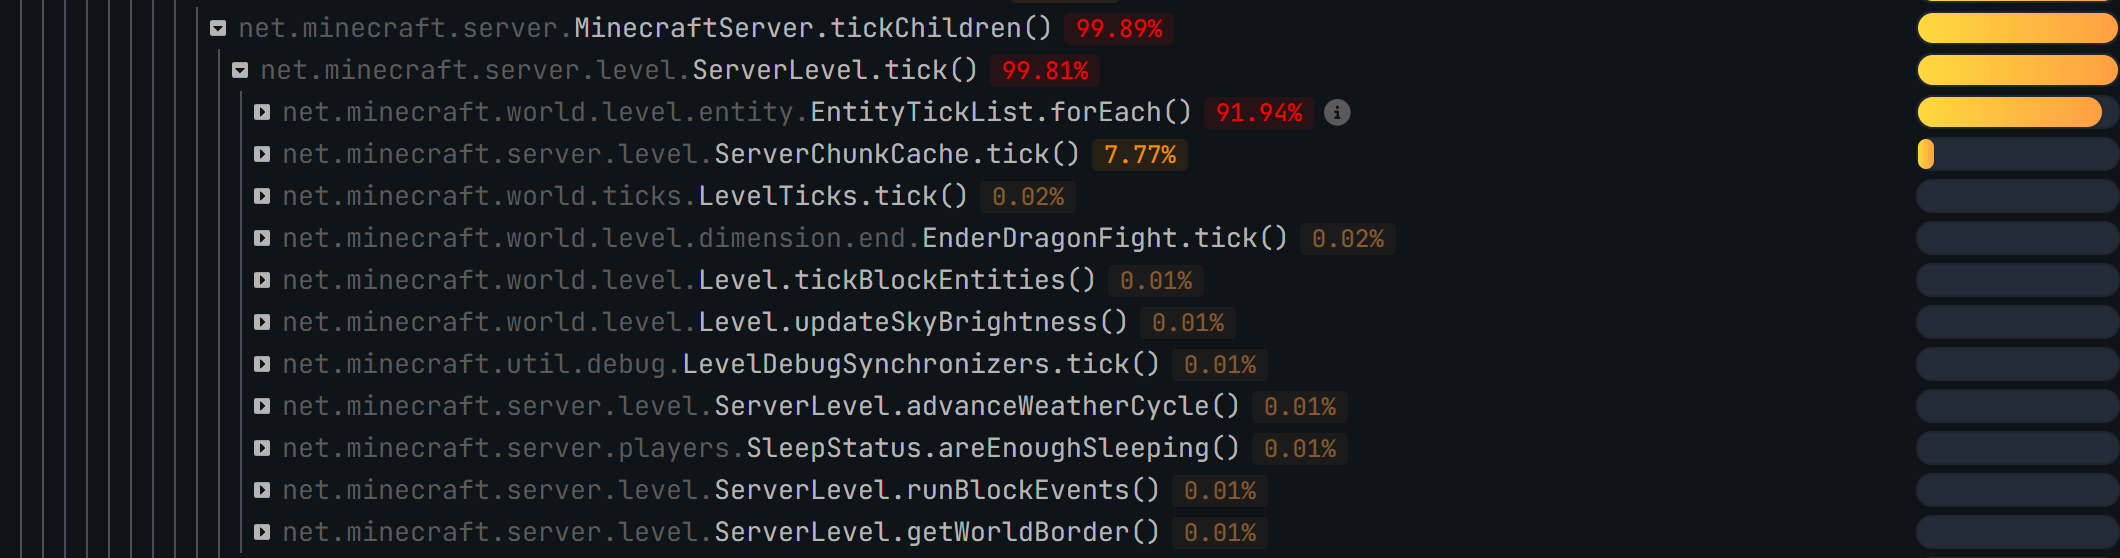
With too many entities, the time in the report concentrates in EntityTickList.forEach(). The screenshot below is a report from a world with too many cows. This item takes 91.94%, and Level.tickBlockEntities() takes only 0.01%:
paper entity list * minecraft:overworld in the server window, and it lists the count of every entity type in the overworld. The screenshot below is a world with 900 cows:
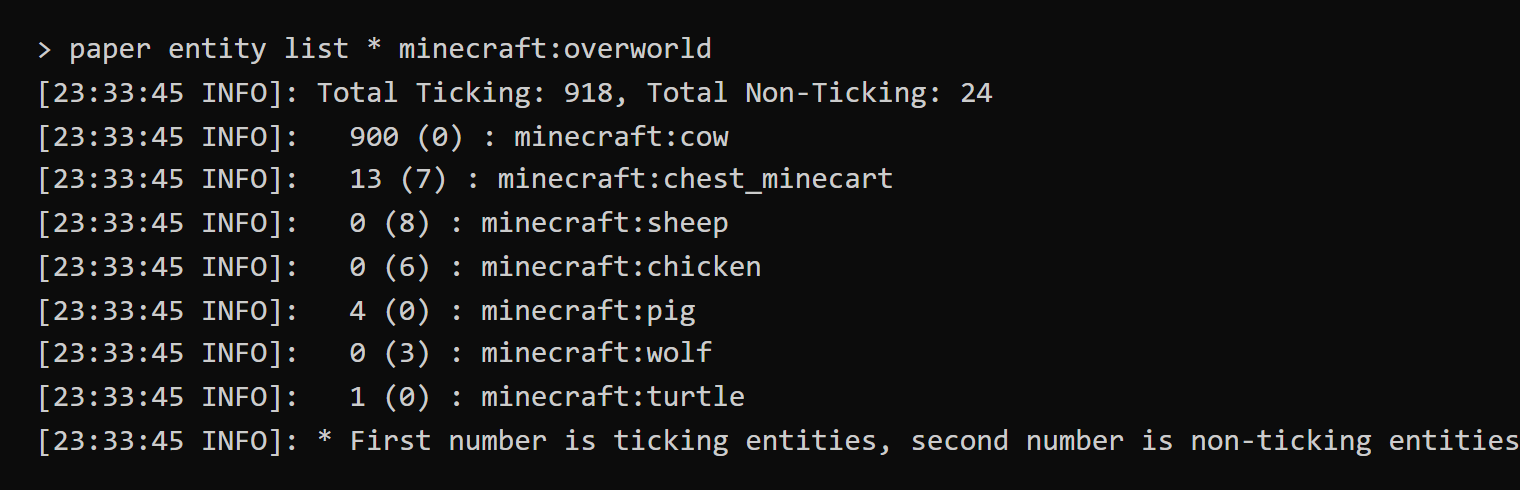
paper entity list minecraft:cow minecraft:overworld and replace minecraft:cow with that type. The server lists the counts by chunk. For example, 49: 0, 0 means chunk coordinates 0, 0 hold 49 of them. Multiply the chunk coordinates by 16 to get block coordinates, teleport there, and reduce the number in the farm or mob grinder.
To clear them all at once, type kill @e[type=minecraft:cow]. This command kills every loaded cow and cannot be undone, so back up the world first.
Report for too many hoppers
With too many hoppers, the time in the report concentrates in Level.tickBlockEntities(), and when you open it, you see HopperBlockEntity:

Report for a plugin causing lag
When a plugin takes too much time, the plugin’s own code names appear under CraftScheduler.mainThreadHeartbeat(). If you move the cursor to the last level, the plugin name also shows on the right. SlowTick in the screenshot is a test plugin I wrote:

plugins folder, and start the server again.
Report for occasional stalls
When the server only stalls now and then, read the report recorded with --only-ticks-over 150. This report keeps only the slow ticks, and you read it the same way as above. The test plugin in the screenshot stalls once every so often, and the item with the largest share is the method that causes the stall:

Confirm the fix
After you fix the cause, wait 30 seconds, type spark tps again, and look at the last 10 seconds before the semicolon in Tick durations. The last minute after the semicolon still includes the time before the fix, so the number is higher. If TPS is back to 20 and the median is below 50 ms, the delay is solved. For occasional stalls, wait past the interval at which the stall used to happen, and then check whether the maximum is back below 50 ms.
Test notes
The test server had no players connected. I retested every scenario in a new world, loaded 64 chunks with forceload, and kept the load for about two minutes. These loads are far larger than a normal server, so use the numbers only to show how to read a report, not to represent a real server. TPS is the last 10 seconds from spark tps, and in every case the fix was to remove the whole load. These are the load and result of each scenario:
| Scenario | Load | Runs | TPS | Median | Median after removal |
|---|---|---|---|---|---|
| Too many entities | 8,000 cows | 3 | 15 to 16.9 | 59 to 66 ms | 1.5 to 1.6 ms |
| Too many hoppers | 196,608 hoppers | 2 | 12.5 to 16.8 | 59 to 78 ms | 0.3 to 0.5 ms |
| Plugin using time | Plugin stalls 60 ms every tick | 1 | 16.5 | 60.6 ms | 0.4 ms |
| Occasional stalls | Plugin stalls 800 ms every 100 ticks | 1 | 18 | 0.4 ms | 0.3 ms |
With no load, TPS was 20 and the median was 0.6 to 1 ms. I set pause-when-empty-seconds in server.properties to -1, so the server does not pause when there are no players. Paper lowers the update rate of entities far from players, so I also set all of entity-activation-range in spigot.yml to 0, so the cows update at the rate they would have with a player standing next to them. With the defaults, the median for 3,000 cows was only 3.4 ms, and with 0 it rises to 16 to 28 ms.
Summary
When the server lags, first check whether the tick time is above 50 ms, then record a report during the lag, and the item with the largest share shows where the delay comes from. The reports for the cows, the hoppers, and the test plugin each identified their source, and after I removed those loads, the median was back below 1.6 ms.